6.5 KiB
(user.widgets.bec_figure)=
BECFigure
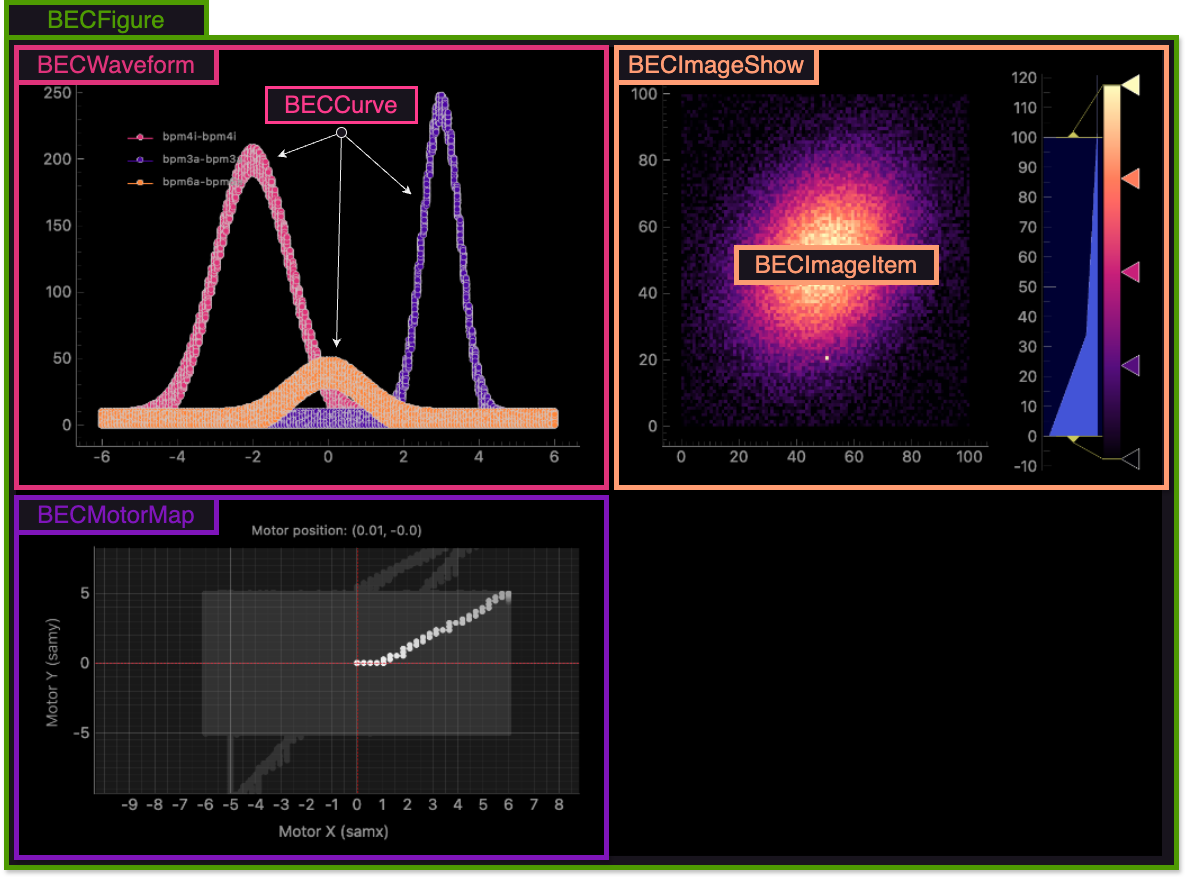
BECFigure is a widget that provides a graphical user interface for creating and managing plots. It is a versatile tool that allows users to create a wide range of plots, from simple 1D waveforms to complex 2D scatter plots. BECFigure is designed to be user-friendly and interactive, enabling users to customize plots and visualize data in real-time.
In the following, we describe 4 different type of widgets thaat are available in BECFigure.
Schema of the BECFigure
1D Waveform Widget
Purpose: This widget provides a straightforward visualization of 1D data. It is particularly useful for plotting positioner movements against detector readings, enabling users to observe correlations and patterns in a simple, linear format.
Key Features:
- Real-time plotting of positioner versus detector values.
- Interactive controls for zooming and panning through the data.
- Customizable visual elements such as line color and style.
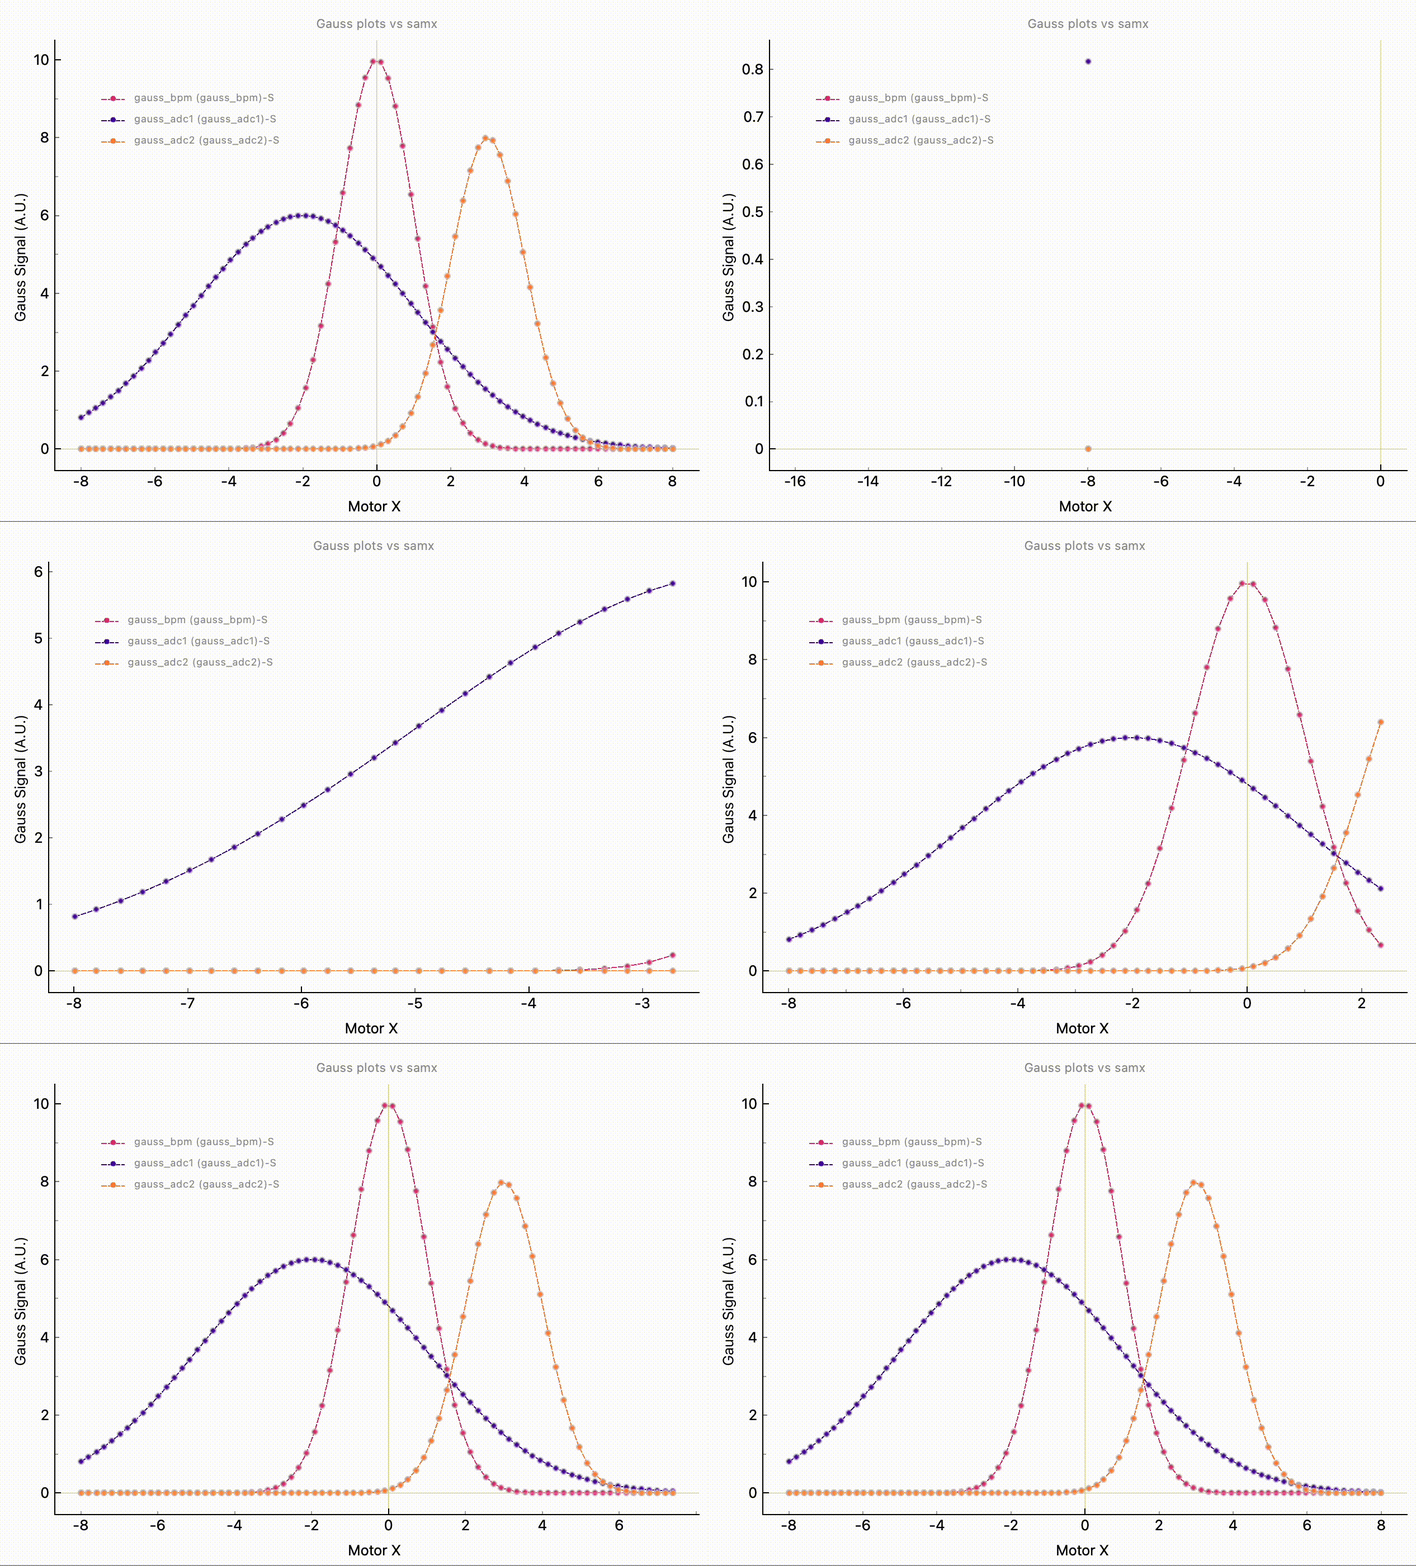
Code example 1 - adding curves
The following code snipped demonstrates how to create a 1D waveform plot using BEC Widgets within BEC. More details about BEC Widgets in BEC can be found in the getting started section within the introduction to the command line.
# adds a new dock, a new BECFigure and a BECWaveForm to the dock
plt = gui.add_dock().add_widget('BECFigure').plot(x_name='samx', y_name='bpm4i')
# add a second curve to the same plot
plt.plot(x_name='samx', y_name='bpm3i')
plt.set_title("Gauss plots vs. samx")
plt.set_x_label("Motor X")
plt.set_y_label("Gauss Signal (A.U.")
Note, the return value of the simulated devices bpm4i and bpm3i may not be gaussian signals, but they can be easily configured with the code snippet below. For more details please check the documentation of the simulation.
# bpm4i uses GaussianModel and samx as a reference; default settings
dev.bpm4i.sim.select_sim_model("GaussianModel")
# bpm3i uses StepModel and samx as a reference; default settings
dev.bpm3i.sim.select_sim_model("StepModel")
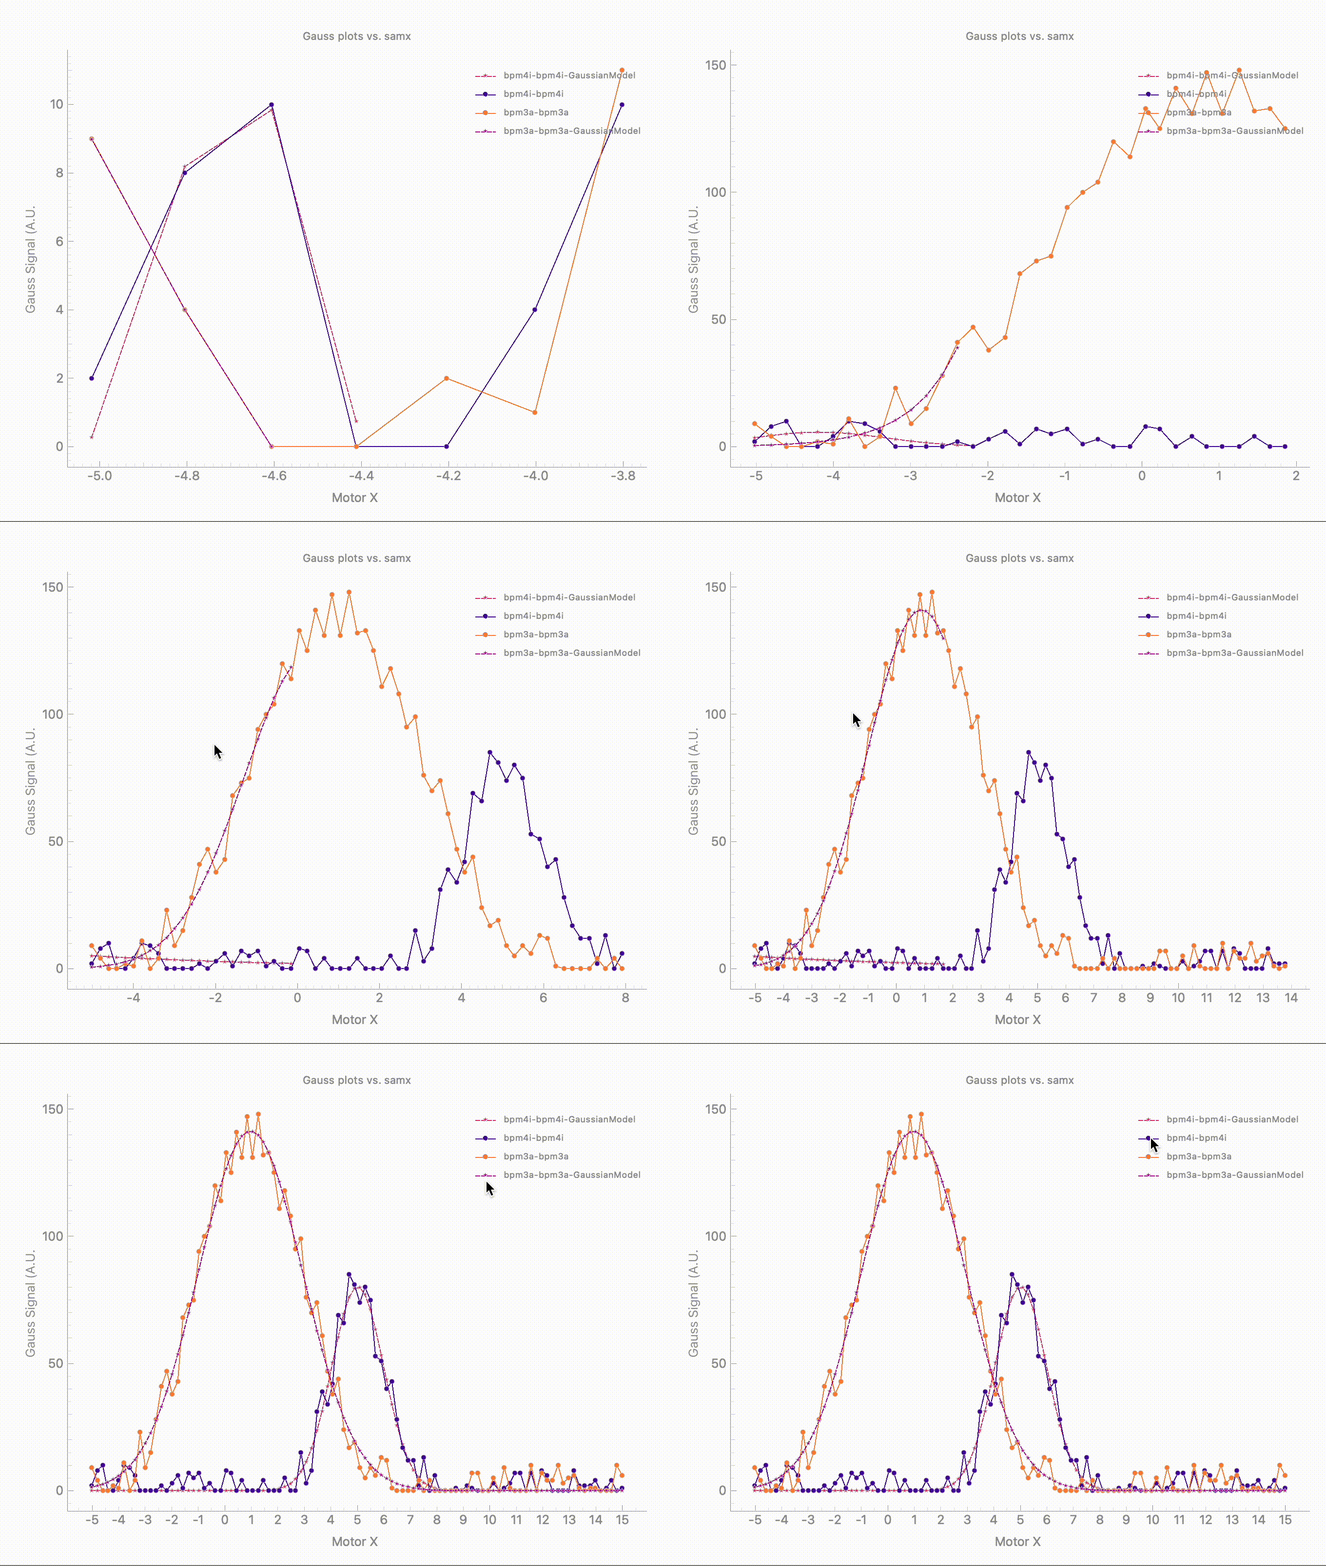
Code example 2 - Adding Data Processing Pipeline Curve with LMFit Models
Together with the scan curve, one can also add a second curve that fits the signal using a specified model from LMFit. The following code snippet demonstrates how to create a 1D waveform curve with an attached DAP process, or how to add a DAP process to an existing curve using the BEC CLI. Please note that for this example, both devices were set as Gaussian signals.
# Add a new dock, a new BECFigure, and a BECWaveForm to the dock with a GaussianModel DAP
plt = gui.add_dock().add_widget('BECFigure').plot(x_name='samx', y_name='bpm4i', dap="GaussianModel")

# Add a second curve to the same plot without DAP
plt.plot(x_name='samx', y_name='bpm3a')

# Add DAP to the second curve
plt.add_dap(x_name='samx', y_name='bpm3a', dap="GaussianModel")
To get the parameters of the fit, one has to retrieve the curve objects and call the dap_params property.
# Get the curve object by name from the legend
dap_bpm4i = plt.get_curve("bpm4i-bpm4i-GaussianModel")
dap_bpm3a = plt.get_curve("bpm3a-bpm3a-GaussianModel")

# Get the parameters of the fit
print(dap_bpm4i.dap_params)
# Output
{'amplitude': 197.399639720862,
 'center': 5.013486095404885,
 'sigma': 0.9820868875739888}

print(dap_bpm3a.dap_params)
# Output
{'amplitude': 698.3072786185278,
 'center': 0.9702840866173836,
 'sigma': 1.97139754785518}
(user.widgets.scatter_2d)=
2D Scatter Plot
Purpose: The 2D scatter plot widget is designed for more complex data visualization. It employs a false color map to represent a third dimension (z-axis), making it an ideal tool for visualizing multidimensional data sets.
Key Features:
- 2D scatter plot with color-coded data points based on a third variable (two positioners for x/y vs. one detector for colormap).
- Interactive false color map for enhanced data interpretation.
- Tools for selecting and inspecting specific data points.
Code example The following code snipped demonstrates how to create a 2D scatter plot using BEC Widgets within BEC.
# adds a new dock, a new BECFigure and a BECWaveForm to the dock
plt = gui.add_dock().add_widget('BECFigure').add_plot(x_name='samx', y_name='samy', z_name='bpm4i')
(user.widgets.motor_map)=
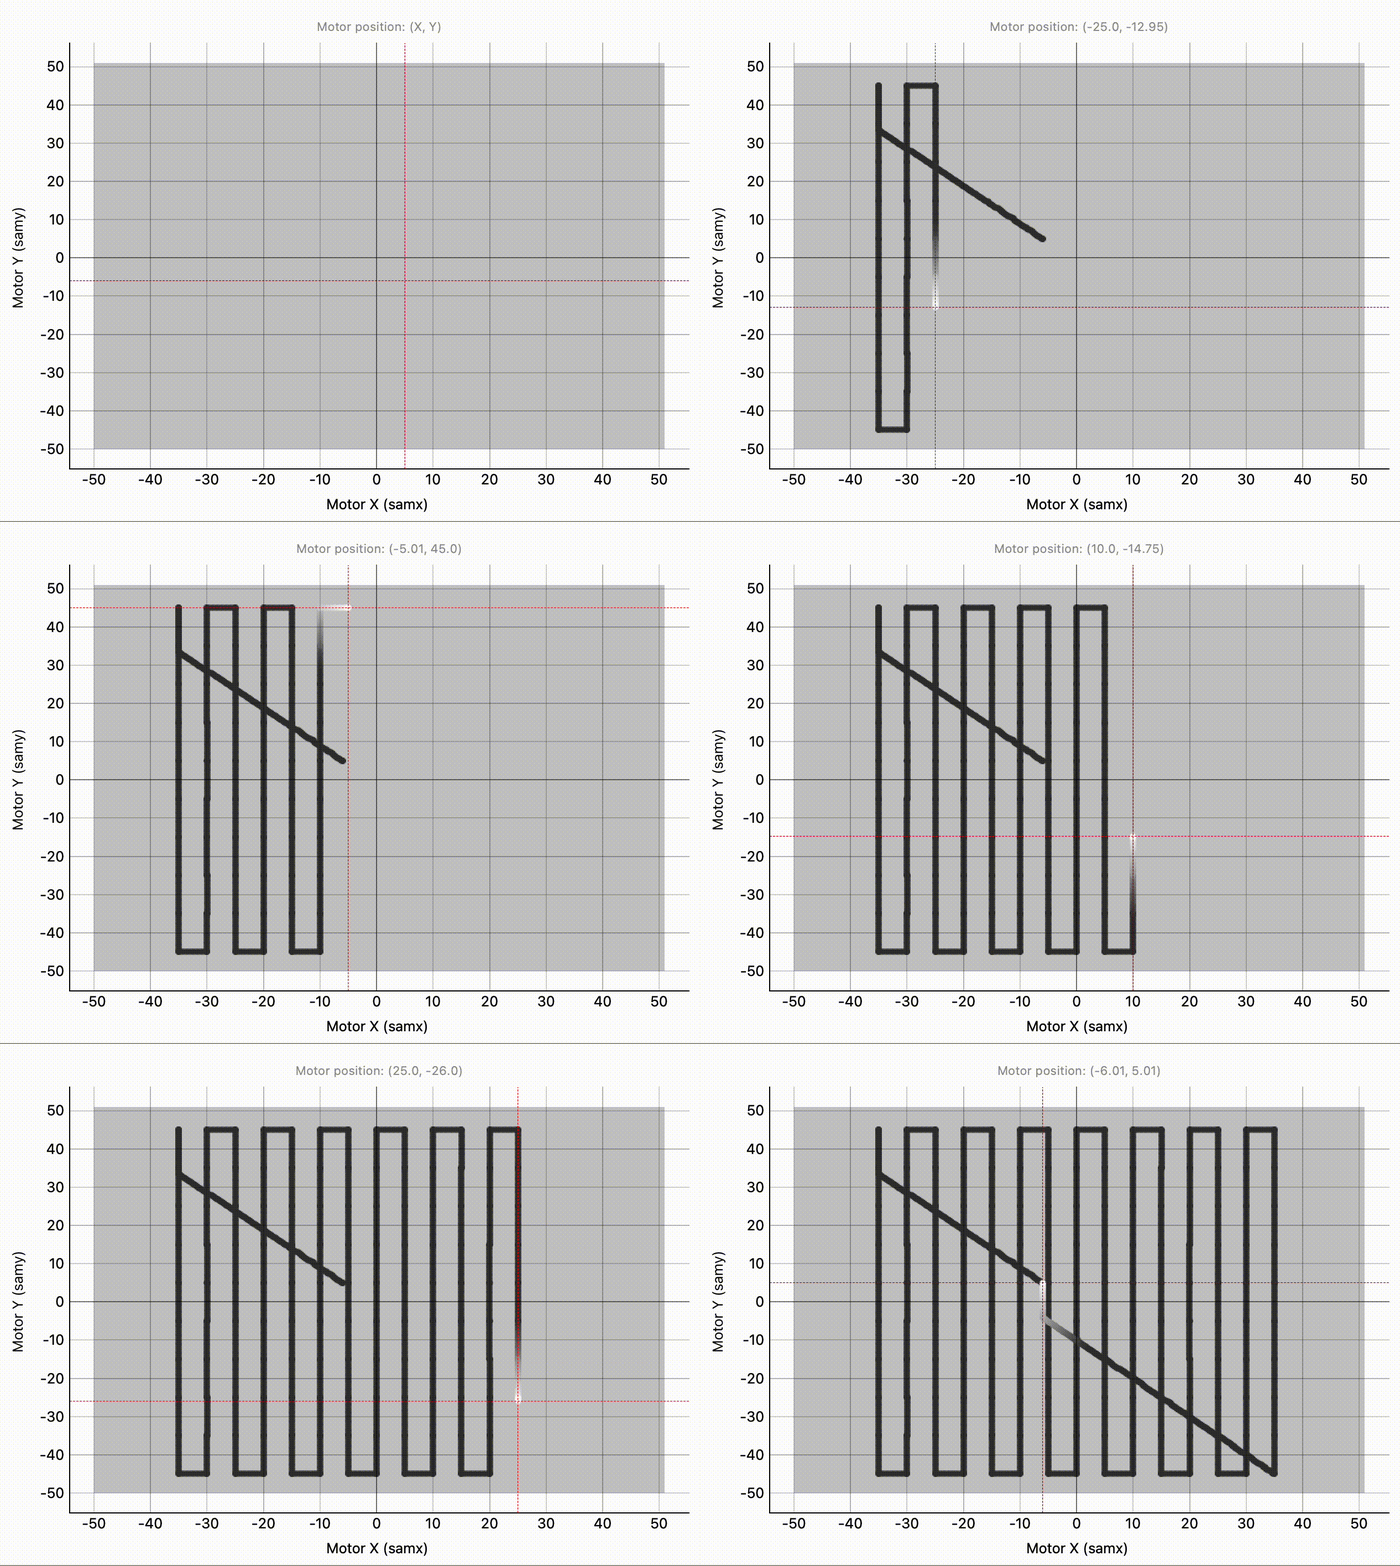
Motor Position Map
Purpose: A specialized component derived from the Motor Alignment Tool. It's focused on tracking and visualizing the position of motors, crucial for precise alignment and movement tracking during scans.
Key Features:
- Real-time tracking of motor positions.
- Visual representation of motor trajectories, aiding in alignment tasks.
Code example The following code snipped demonstrates how to create a motor map using BEC Widgets within BEC.
# add a motor map to the gui
mot_map = gui.add_dock().add_widget('BECFigure').motor_map('samx', 'samy')
# change the number of points displayed
(user.widgets.image_2d)=
Image Plot
Purpose: A versatile widget for visualizing 2D image data, such as camera images. It provides a detailed representation of image data, with an attached color and scale bar to dynamically adjust the image display.
Key Features:
- Live-plotting of 2D image data from cameras (if data stream is available in BEC).
- Color maps and scale bars for customizing image display.
Example of Use:

Code example The following code snipped demonstrates how to create a motor map using BEC Widgets within BEC.
# add a camera view for the eiger camera to the gui
cam_widget = gui.add_dock().add_widget('BECFigure').image('eiger')
# set the title of the camera view
cam_widget.set_title("Camera Image Eiger")
# change the color map range, e.g. from 0 to 100, per default it is autoscaling
# Note, the simulation has hot pixels on the detector
cam_widget.set_vrange(vmin=0, vmax=100)


