1.9 KiB
(user.widgets)=
Widgets
Visualization Widgets
BEC Widgets includes a variety of visualization widgets designed to cater to diverse data representation needs in beamline experiments. These widgets enhance the user experience by providing intuitive and interactive data visualizations.
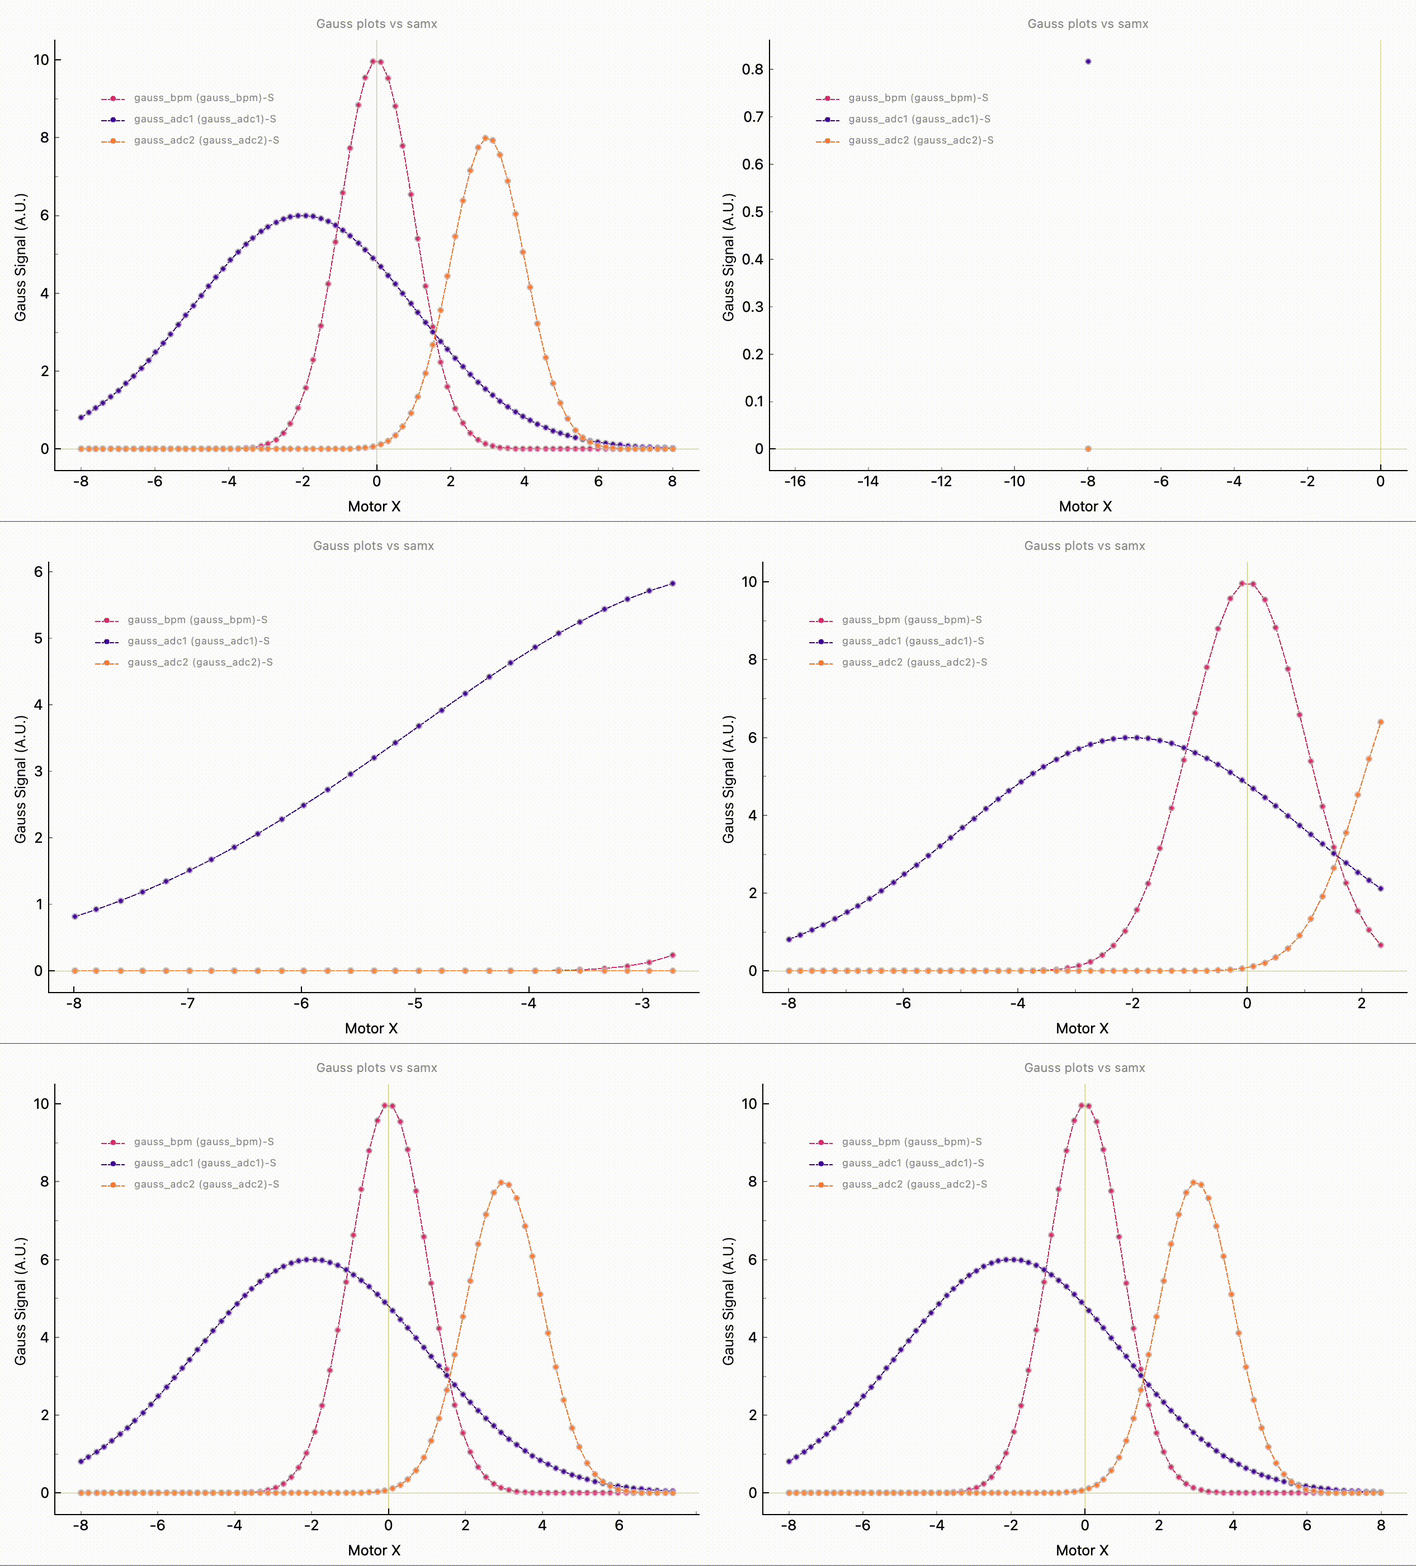
1D Waveform Widget
Purpose: This widget provides a straightforward visualization of 1D data. It is particularly useful for plotting positioner movements against detector readings, enabling users to observe correlations and patterns in a simple, linear format.
Key Features:
- Real-time plotting of positioner versus detector values.
- Interactive controls for zooming and panning through the data.
- Customizable visual elements such as line color and style.
2D Scatter Plot
Purpose: The 2D scatter plot widget is designed for more complex data visualization. It employs a false color map to represent a third dimension (z-axis), making it an ideal tool for visualizing multidimensional data sets.
Key Features:
- 2D scatter plot with color-coded data points based on a third variable (two positioners for x/y vs. one detector for colormap).
- Interactive false color map for enhanced data interpretation.
- Tools for selecting and inspecting specific data points.
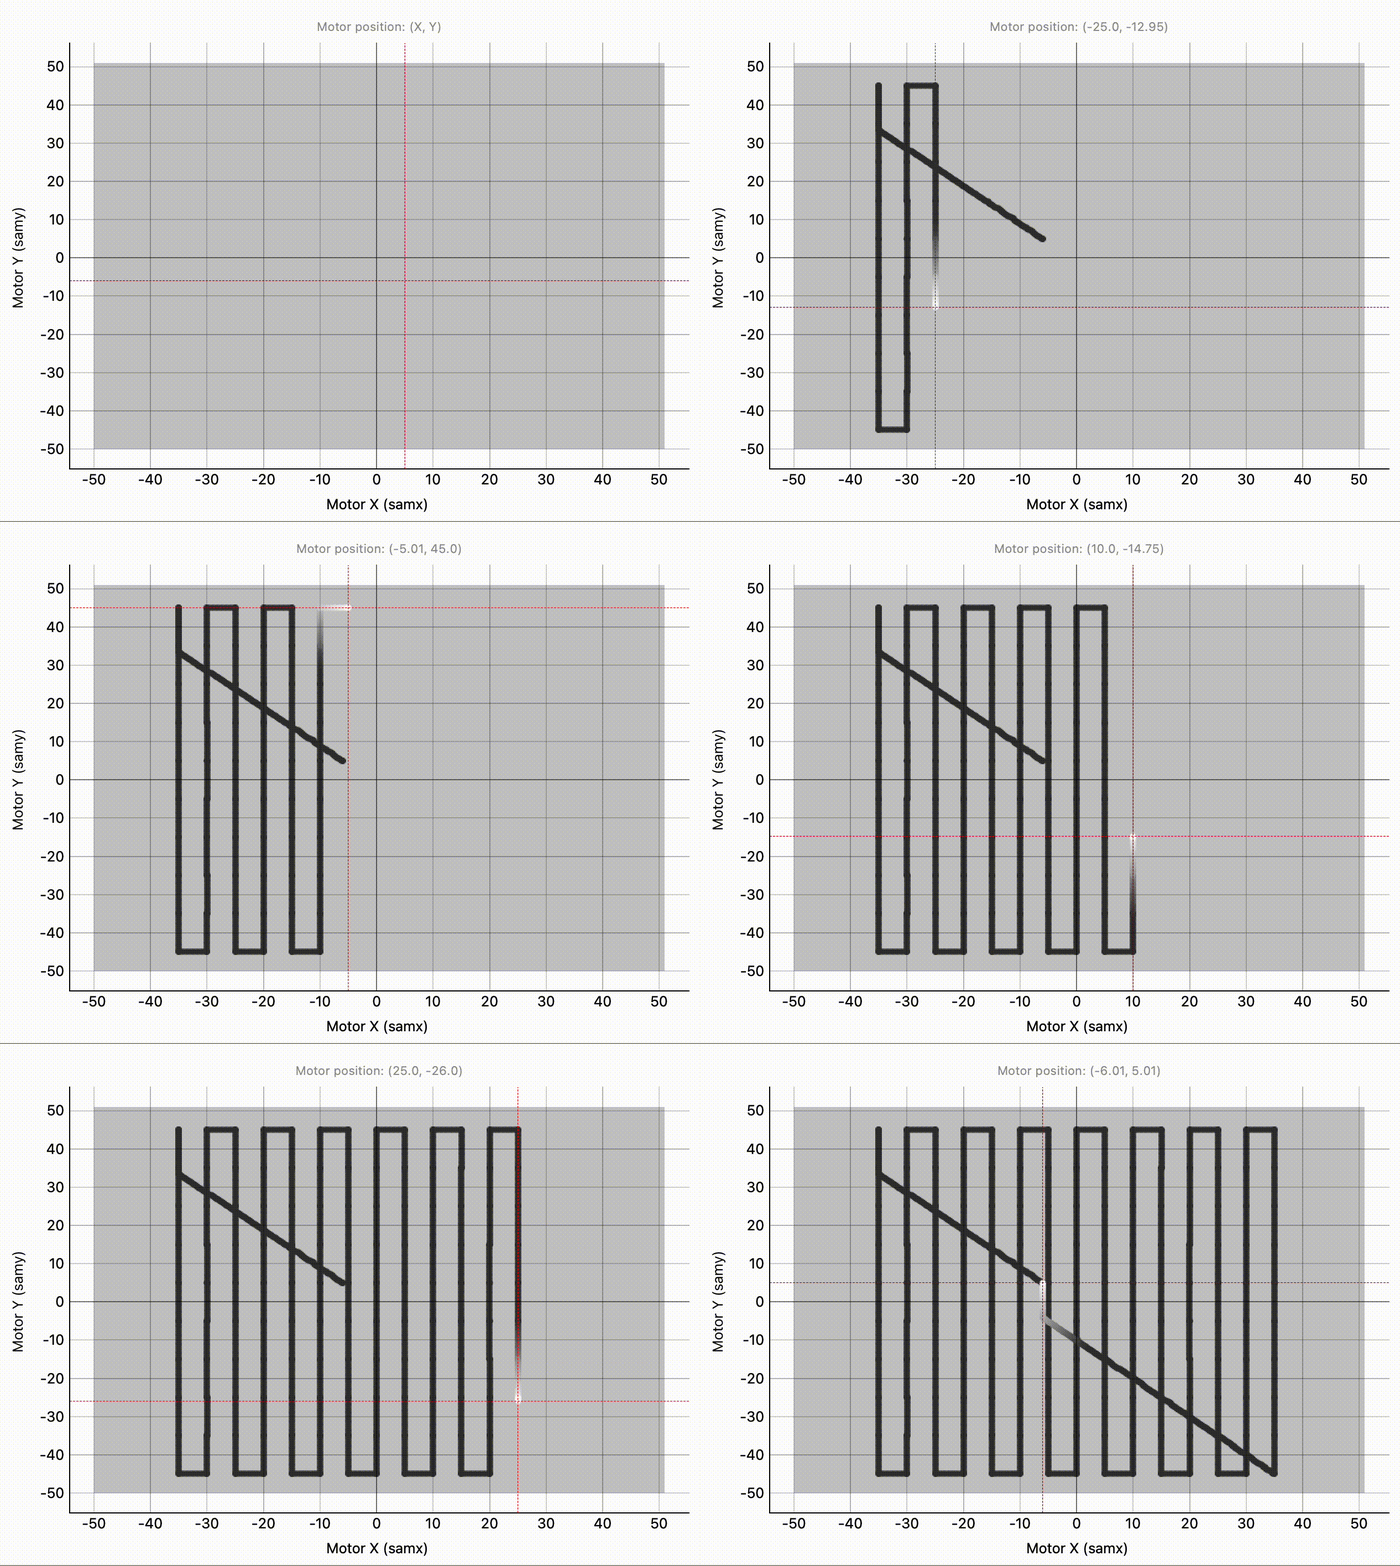
Motor Position Map
Purpose: A specialized component derived from the Motor Alignment Tool. It's focused on tracking and visualizing the position of motors, crucial for precise alignment and movement tracking during scans.
Key Features:
- Real-time tracking of motor positions.
- Visual representation of motor trajectories, aiding in alignment tasks.
- Ability to record and recall specific motor positions for repetitive tasks.


