Overview
This document provides instructions on how to install and to operate the data acquisition (daq) environment.
The DataBuffer currently consists of 13 nodes located in the server room next to the control room in WBGB. The nodes are located in the SwissFEL network and are named sf-daqbuf-21 up to sf-daqbuf-33.
Each node of the cluster currently runs 2 independent services:
- daq-dispatcher-node.service - used to dispatch and record data (filestorage-cluster)
- daq-query-node.service - used to query data
The machines are installed and managed via ansible scripts and playbooks. To be able to run these scripts password-less ssh needs to be setup from the machine running these scripts.
Prerequisites
Note: This is not needed if working on a standard GFA machine like sflca!
To be able to execute the steps and commands outlined in this document following prerequisites need to be met:
-
Ansible needs to be installed on your machine
-
Password-less ssh needs to be setup from your machine
- Use
ssh-copy-idto copy your public key to the serversssh-copy-id your-user@sf-daqbuf-xx.psi.ch - Have a tunneling directive in your ~/.ssh/config like this:
Host sfbastion
  Hostname sf-gw.psi.ch
  ControlMaster auto
  ControlPath ~/.ssh/mux-%r@%h:%p
  ControlPersist 8h

Host sf-data-api* sf-dispatcher-api* sf-daq*
  Hostname %h
  ProxyJump username@sfbastion
- Use
-
Sudo rights are needed on databuffer/... servers
-
Clone the sf_databuffer repository and switch to the
operation-toolsfolder
Checks
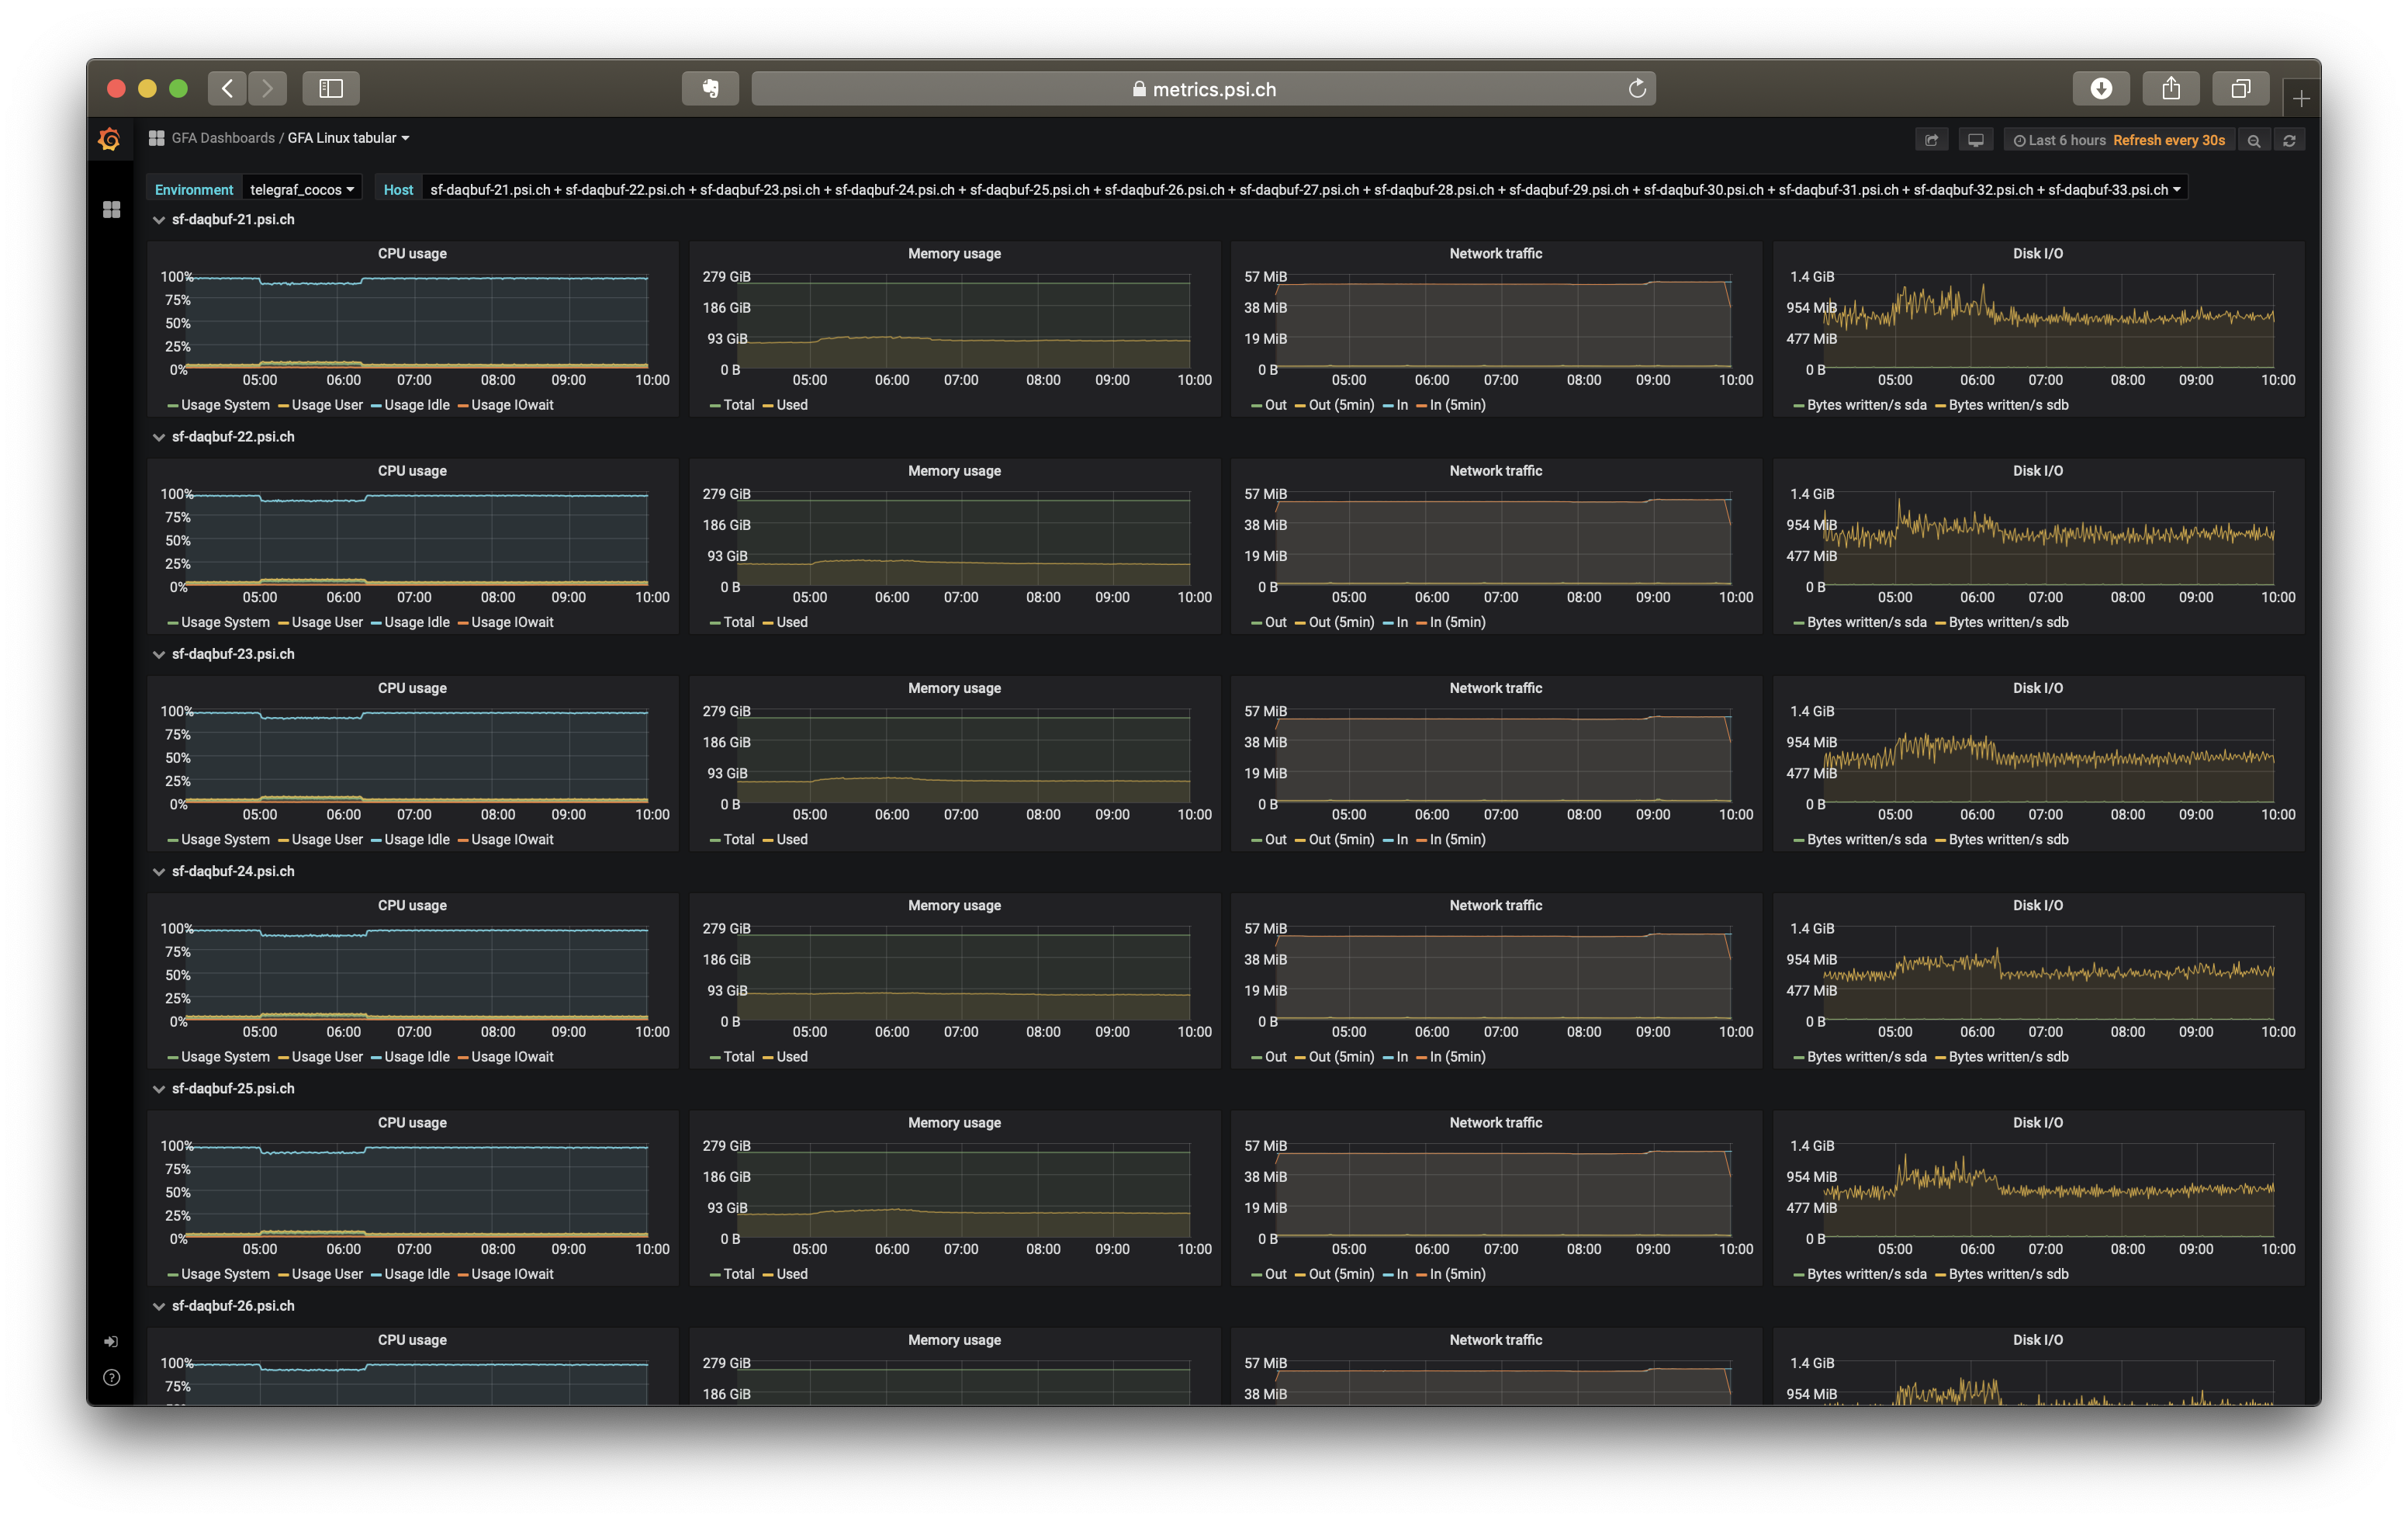
A healthy network load looks something like this:

If more than 2 machines does not show this pattern - the DataBuffer has an issue.
Check disk free DataBuffer: http://gmeta00.psi.ch/?r=hour&cs=&ce=&c=sf-daqbuf&h=&tab=m&vn=&hide-hf=false&m=disk_free_percent_data&sh=1&z=small&hc=4&host_regex=&max_graphs=0&s=by+name
Checks on the cluster can be performed via ansible ad-hoc commands:
ansible databuffer -m shell -a 'uptime'
Find Sources With Issues
Find sources with bsread level issues https://kibana.psi.ch/s/gfa/app/dashboards#/view/1b1e1bb0-ca94-11ea-bc5d-315bf3957d13?_g=(filters:!(),refreshInterval:(pause:!t,value:0),time:(from:now-15m,to:now))&_a=(description:'',filters:!(('$state':(store:appState),meta:(alias:'Connection%20Errors',disabled:!f,index:'2e885ee0-c5d0-11ea-82c0-2da95a58e9d4',key:bsread.error.type,negate:!t,params:!('0','1','2'),type:phrases,value:'0,%201,%202'),query:(bool:(minimum_should_match:1,should:!((match_phrase:(bsread.error.type:'0')),(match_phrase:(bsread.error.type:'1')),(match_phrase:(bsread.error.type:'2'))))))),fullScreenMode:!f,options:(hidePanelTitles:!f,useMargins:!t),query:(language:kuery,query:''),timeRestore:!f,title:'BSREAD%20Errors%20DataBuffer',viewMode:view)
Error number indicate following errors:
- 0-pulse / 0 globaltime
- time out of valid timerange
- duplicate pulse-id
- pulse-id before last valid pulse-id
- duplicate globaltimestamp
- globaltimestamp before last globaltimestamp
To see connection errors as well temporarily disable the "NOT Connection Errors" filter on the top left (click on the filter and select "Temporarily disable")
The error numbers used there are
- receiver connected
- receiver stopped
- reconnect
Find channels that are received from more than one source: https://kibana.psi.ch/s/gfa/app/discover#/view/cb725720-ca89-11ea-bc5d-315bf3957d13?_g=(filters:!(),refreshInterval:(pause:!t,value:0),time:(from:now-15m,to:now))&_a=(columns:!(bsread.error.type,bsread.source,message),filters:!(('$state':(store:appState),meta:(alias:!n,disabled:!f,index:'2e885ee0-c5d0-11ea-82c0-2da95a58e9d4',key:systemd.unit,negate:!f,params:(query:daq-dispatcher-node.service),type:phrase),query:(match_phrase:(systemd.unit:daq-dispatcher-node.service)))),index:'2e885ee0-c5d0-11ea-82c0-2da95a58e9d4',interval:auto,query:(language:kuery,query:'%22This%20is%20usually%20an%20indication%22'),sort:!(!('@timestamp',desc)))
Find channels that send corrupt MainHeader: https://kibana.psi.ch/s/gfa/app/discover#/view/cb725720-ca89-11ea-bc5d-315bf3957d13?_g=(filters:!(),refreshInterval:(pause:!t,value:0),time:(from:now-15m,to:now))&_a=(columns:!(bsread.error.type,bsread.source,message),filters:!(('$state':(store:appState),meta:(alias:!n,disabled:!f,index:'2e885ee0-c5d0-11ea-82c0-2da95a58e9d4',key:systemd.unit,negate:!f,params:(query:daq-dispatcher-node.service),type:phrase),query:(match_phrase:(systemd.unit:daq-dispatcher-node.service)))),index:'2e885ee0-c5d0-11ea-82c0-2da95a58e9d4',interval:auto,query:(language:kuery,query:MainHeader),sort:!(!('@timestamp',desc)))
Maintenance
Restart Procedures
Following are restart procedures meant for emergency interventions on the SwissFEL DAQ system
Before issuing a restart check the which endstations are attended via one of the following operations panel and check whether a restart is ok with all attended endstations!
bash -c 'caqtdm -noMsg  -stylefile sfop.qss -macro chargelim=15  S_OP_overview.ui'
bash -c 'caqtdm -noMsg  -stylefile sfop.qss -macro chargelim=15  S_OP_overview_for_photonics.ui'
bash -c 'caqtdm -noMsg  -stylefile sfop.qss   S_OP_Messages_all_stations_small.ui'
Inform the sf-operations@psi.ch mailing list before the restart!
Restart DataBuffer
This is the procedure to follow to restart the DataBuffer in an emergency.
After checking whether the restart is really necessary do this:
- login to sf-lca.psi.ch (sflca is cluster in the machine network !!!!)
- clone the databuffer repository (if you haven't yet), change to the operation-tools directory and/or pull the latest changes
git clone https://git.psi.ch/archiver_config/sf_databuffer.git
cd sf_databuffer/operation-tools
# and/or
git pull
- call the restart script
ansible-playbook restart.yml
- Afterwards restart the recording again:
cd ..
./bufferutils upload